LENS TEST / COLOR & RESOLUTION
Color Lens Test Chart
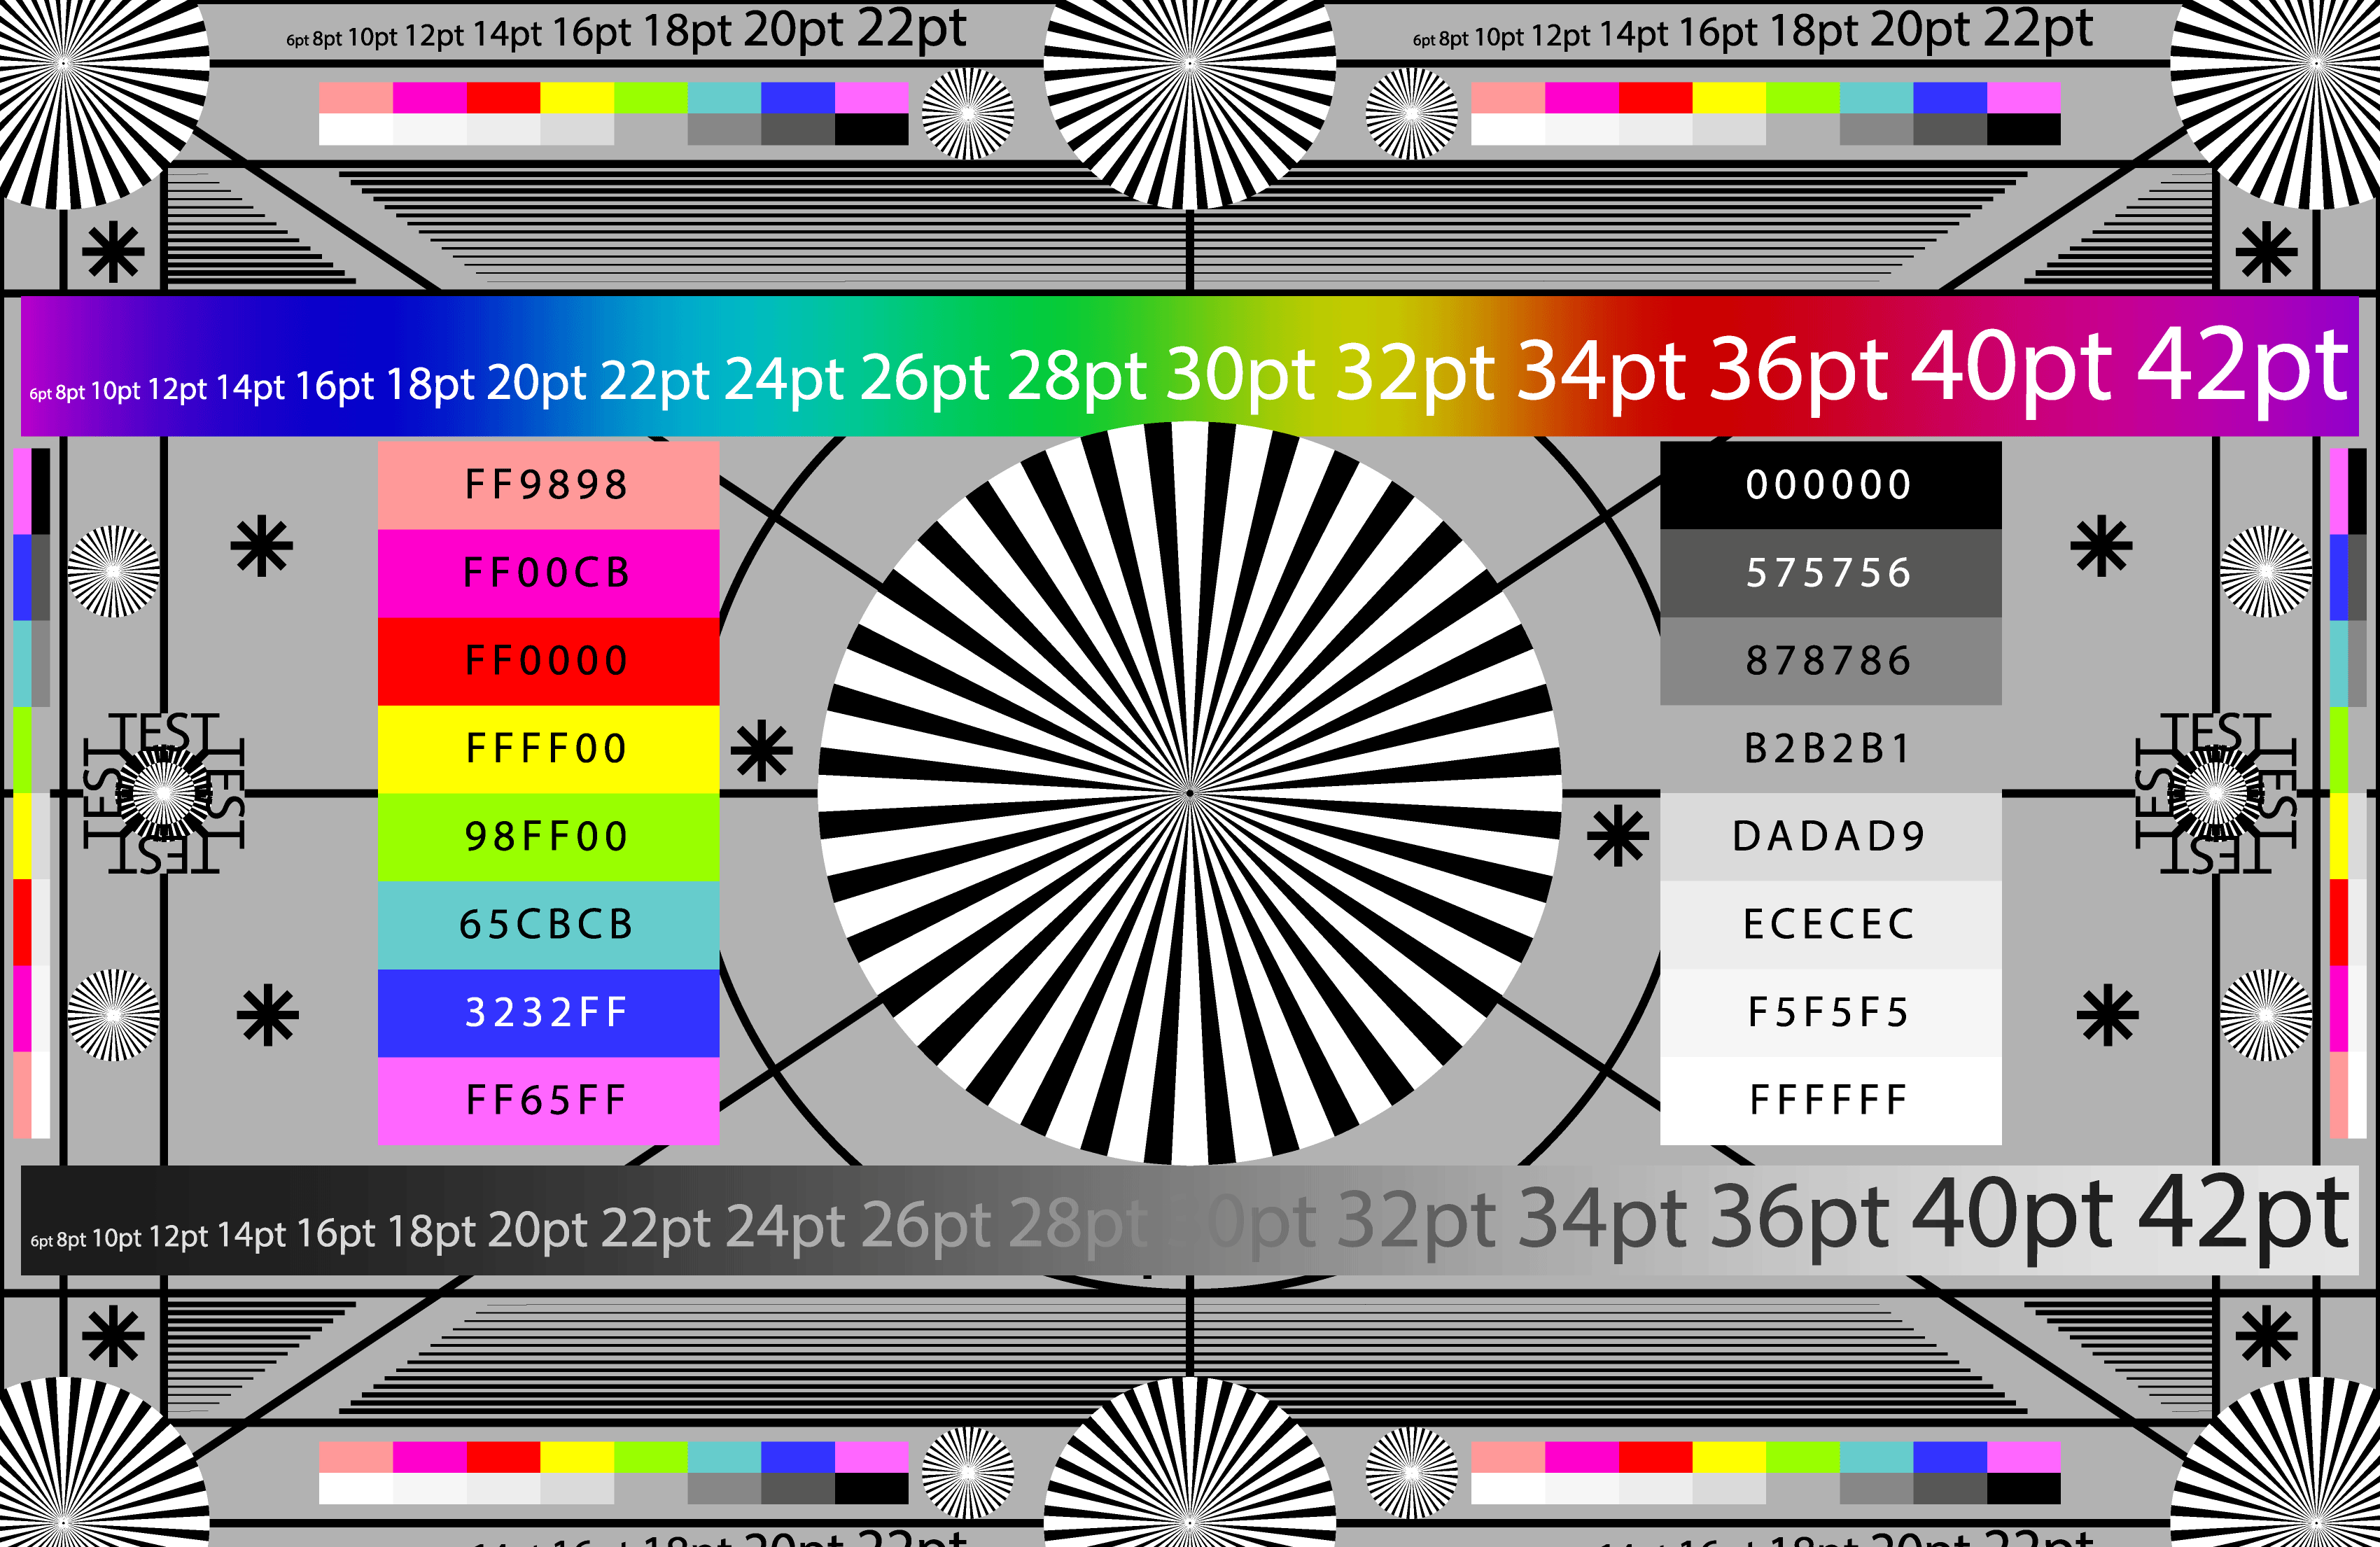
A mixed color, tone and radial-detail target for controlled comparisons between lenses, apertures and processing settings.
FIELD METHOD
CONTROL THE COMPARISON
- Use neutral, even light.Avoid mixed illumination and glare; keep white balance, exposure and picture profile fixed.
- Protect the highlights.Expose so the white patches do not clip, and use RAW when comparing lenses or profiles later.
- Match every variable.Keep camera position, focal length, focus method and processing identical when changing aperture or lens.
- Inspect at equal scale.Compare the center, edges and corners at the same display zoom, then repeat the capture to confirm the result.
INTERPRETATION
SEPARATE OPTICS FROM PROCESSING
Radial wedges expose resolution loss and aliasing; high-contrast boundaries make lateral color fringes and halos easier to compare; neutral steps reveal clipping or compressed tones. A difference that moves with software sharpening or a profile is not purely optical.
Not a colorimetric chart. The screen is useful for repeatable visual comparison, but its patches are not measured standards for ICC profiles, camera characterization or absolute color accuracy.